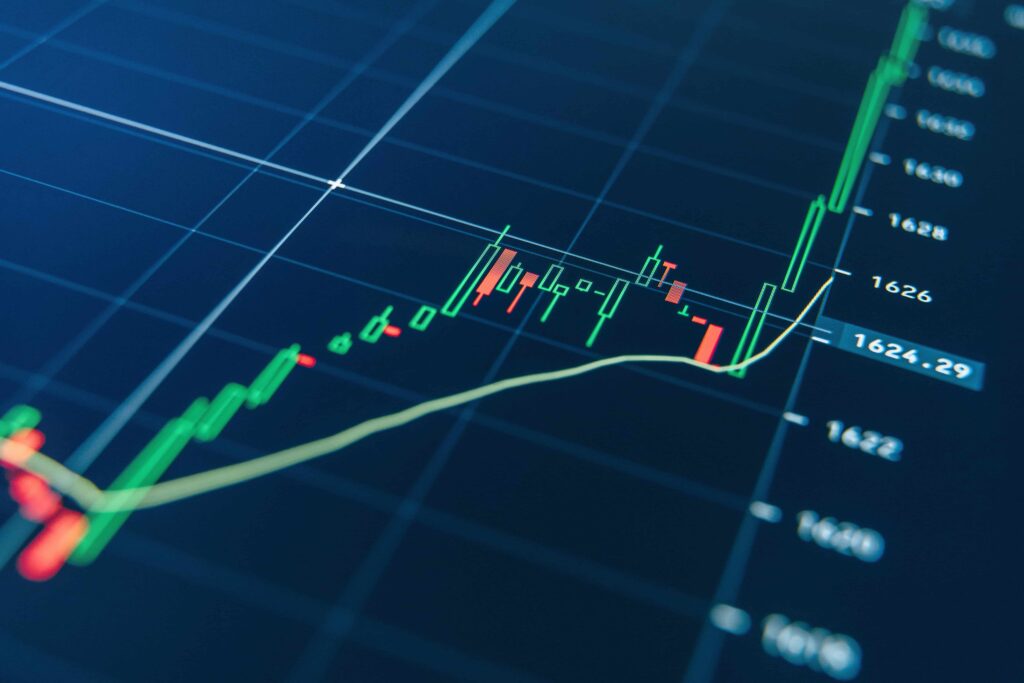
In the ever-evolving world of trading, staying ahead of the curve is essential. As an expert in scalping, trading, and EA, you understand the critical role that technical indicators play in successful trading strategies. These trading indicators serve as invaluable tools, offering insights into market trends, price movements, and potential entry and exit points. In this comprehensive guide, we’ll delve into the world of trading indicators, exploring the top technical indicators that are widely used by traders and investors to make informed decisions and enhance their trading performance.

Understanding Technical Indicators
Technical indicators are mathematical calculations based on historical price, volume, or open interest data. These calculations generate graphical or numerical outputs, aiding traders in analyzing market trends and patterns. While there are countless technical indicators available, each with its own unique purpose, this guide will focus on the most commonly used ones.
Moving Averages (MA)
Moving averages are fundamental indicators that smooth out price data over a specified period, making it easier to identify trends. The two primary types are:
Simple Moving Average (SMA)
The SMA calculates the average price over a defined time frame, providing a clear picture of the overall trend. Traders often use the crossover of short-term and long-term SMAs to identify potential buy and sell signals.
Exponential Moving Average (EMA)
The EMA places more weight on recent price data, reacting faster to price changes compared to the SMA. This indicator is favored by traders seeking more timely signals.
Relative Strength Index (RSI)
The RSI is a momentum oscillator that measures the speed and change of price movements. It ranges from 0 to 100 and is used to identify overbought or oversold conditions. A reading above 70 suggests overbought, while a reading below 30 suggests oversold, potentially indicating a reversal.
Moving Average Convergence Divergence (MACD)
The MACD is a versatile indicator that combines two moving averages and oscillators. It consists of the MACD line, signal line, and histogram. Traders analyze crossovers and divergences between these lines to identify potential trend shifts.

Utilizing Technical Indicators for Successful Trading
As an expert in scalping, trading, and EA, you understand that the effectiveness of technical indicators lies in their application within a robust trading strategy. Here’s how you can leverage these indicators for optimal results:
- Combining Indicators: Avoid relying solely on one indicator. Instead, combine multiple indicators to confirm signals and reduce false alarms.
- Backtesting: Before deploying any trading strategy, conduct thorough backtesting using historical data. This helps you gauge the indicator’s performance in various market conditions.
- Risk Management: While indicators provide insights, they are not foolproof. Implement sound risk management techniques to protect your capital.
- Market Context: Consider the broader market context, including economic news, geopolitical events, and market sentiment, when interpreting indicator signals.
Elevating Your Trading Strategy
In the fast-paced world of trading, staying ahead requires a comprehensive understanding of technical indicators and their role within your strategy. By incorporating moving averages, RSI, MACD, and other relevant indicators, you can make more informed decisions and increase your chances of success.
Remember, the key is not just to rely on indicators but to use them as part of a holistic trading approach. As you execute your trades, keep a keen eye on market developments and be prepared to adapt your strategy accordingly.
In conclusion, as a seasoned trader, you possess the knowledge and experience to make the most of technical indicators. By integrating these tools into your trading arsenal, you’re positioning yourself for a competitive edge in the dynamic world of trading. So, continue to refine your strategy, embrace new insights, and let your expertise shine.
Final Thoughts
In the realm of trading, mastering the art of interpreting technical indicators can set you apart as a successful trader. By understanding the nuances of moving averages, RSI, MACD, and their applications, you’re equipping yourself with valuable tools to navigate the complexities of the financial markets. Remember, while indicators provide valuable insights, they are most potent when combined with a strategic approach and a deep understanding of market dynamics.
In your journey toward becoming a top-tier trader, never underestimate the power of continuous learning and adaptation. The trading landscape evolves, and so should your strategies. As you utilize the insights from this guide, keep refining your skills and exploring new ways to leverage technical indicators effectively.
To sum up, technical indicators are the compass in your trading journey, guiding you through the intricate paths of the financial markets. Armed with knowledge, experience, and a keen understanding of these indicators, you’re poised for success in your trading endeavors.
Remember, success in trading requires not only technical prowess but also discipline, risk management, and a thorough understanding of market psychology. As you embark on this exciting and challenging journey, may your trades be profitable, and your strategies be ever-adapting.

